 |
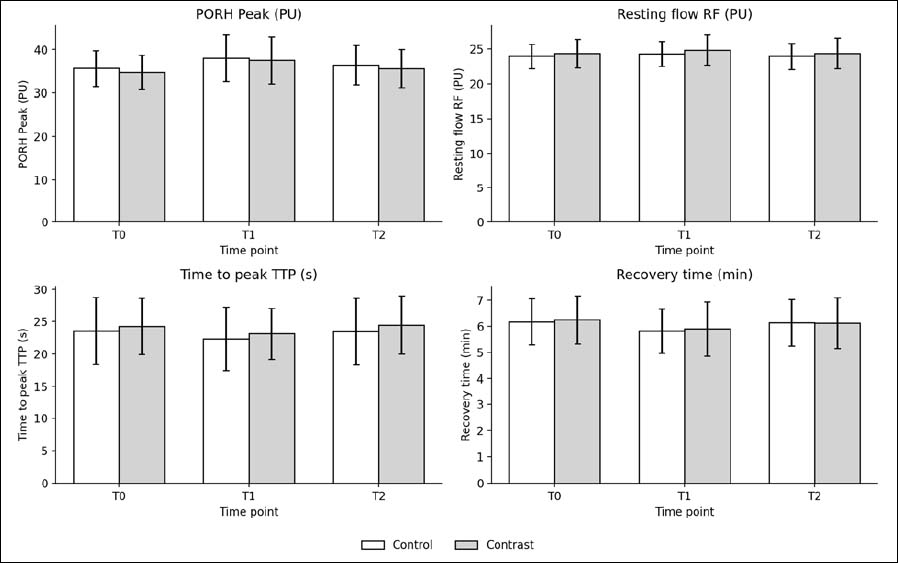
Figure 4.
PORH microvascular outcomes across time points (per-protocol). Bars show mean values and error bars show SD. Control and contrast heat–cold groups are displayed side-by-side at each time point (T0 baseline, T1 post-intervention, T2 post wash-out). HRV, heart rate variability; lnRMSSD, natural logarithm of the root mean square of successive differences; RMSSD, root mean square of successive differences; SDNN, standard deviation of NN intervals; PORH, post-occlusive reactive hyperemia; TTP, time to peak; TQR, Total Quality Recovery; SD, standard deviation; CI, confidence interval; RRR, ratio of ratios.