 |
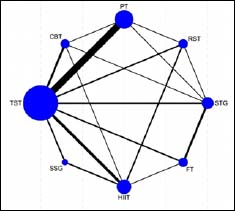
Figure 2.
Network plot of comparisons among different training modalities. Node size is proportional to the number of participants contributing to each intervention node, and line thickness represents the number of direct comparisons between interventions. Most direct comparisons involved TST as the comparator, whereas direct head-to-head comparisons between active interventions were relatively limited.