 |
Figure 4.
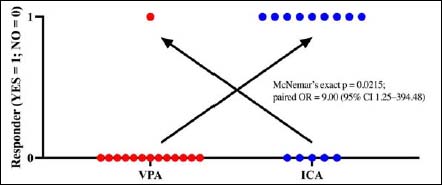
Paired responder status by condition. Dots show individual participants (1 = responder; ΔCMJ ≥ 0.77 cm; 0 = non-responder).
|
|
|
Figure 4.
Paired responder status by condition. Dots show individual participants (1 = responder; ΔCMJ ≥ 0.77 cm; 0 = non-responder).
|