 |
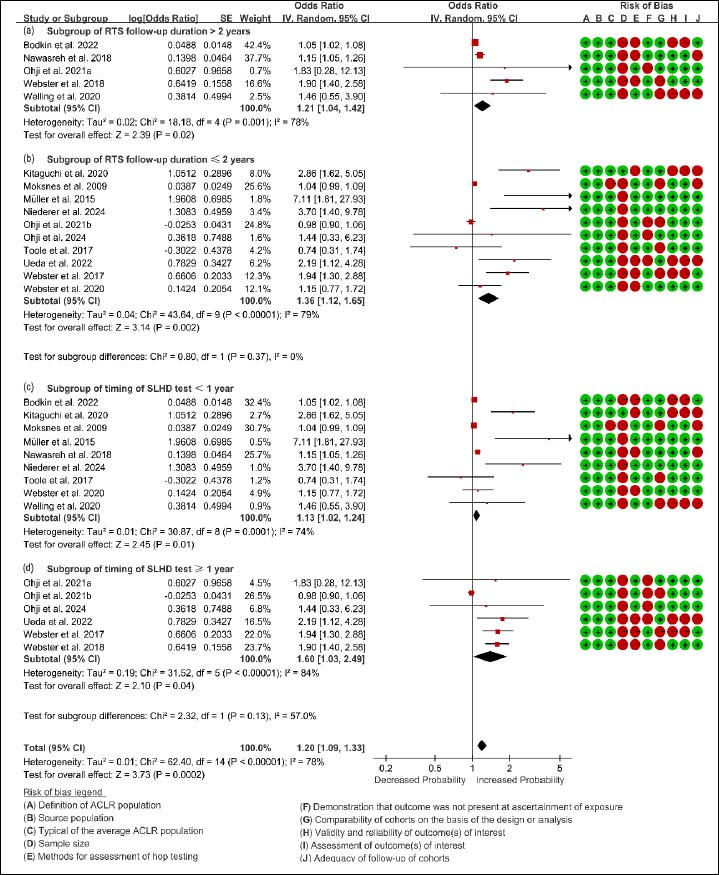
Figure 6.
Forest plot displaying subgroup analyses of follow-up duration and testing timing in association between achieving LSI (limb symmetry index) ≥ 90% in single-leg hop for distance (SLHD) and RTS (return to sports), and quality assessment of each study using modified Newcastle-Ottawa Scale.