 |
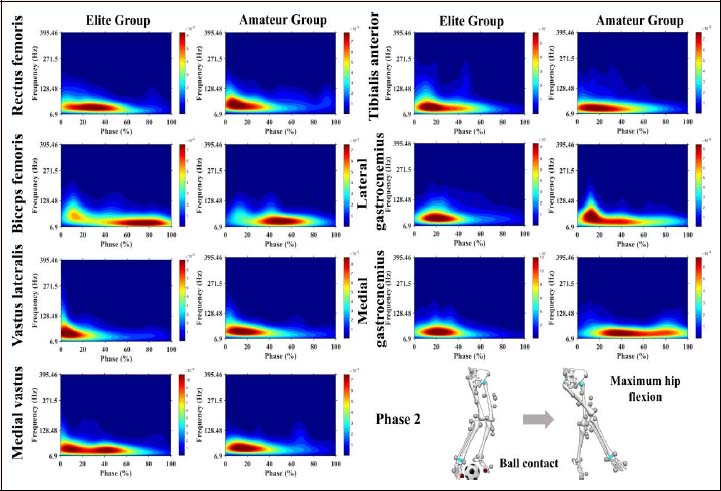
Figure 3.
Time frequency heat maps illustrating the mean wavelet intensity patterns of lower limb muscle activation during Phase 2 of the instep kick. The X-axis represents the progression of Phase 2 on a normalized time scale, the Y-axis depicts EMG frequency ranges analyzed. Wavelet intensity was normalized after Morlet wavelet transformation using a participant-specific, muscle-specific, and phase-specific scaling factor. The color gradient represents normalized wavelet intensity and was shared across all muscles and both groups, with color-scale limits fixed from 0.000001 to 0.007992.