 |
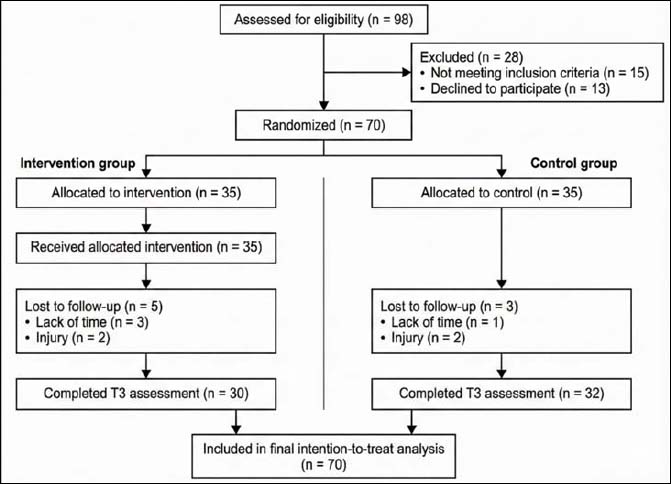
Figure 1.
CONSORT flow diagram of participant recruitment and retention. The final intention-to-treat analysis included all randomized participants (intervention group n=35; control group n=35), including eight participants who withdrew after randomization.