 |
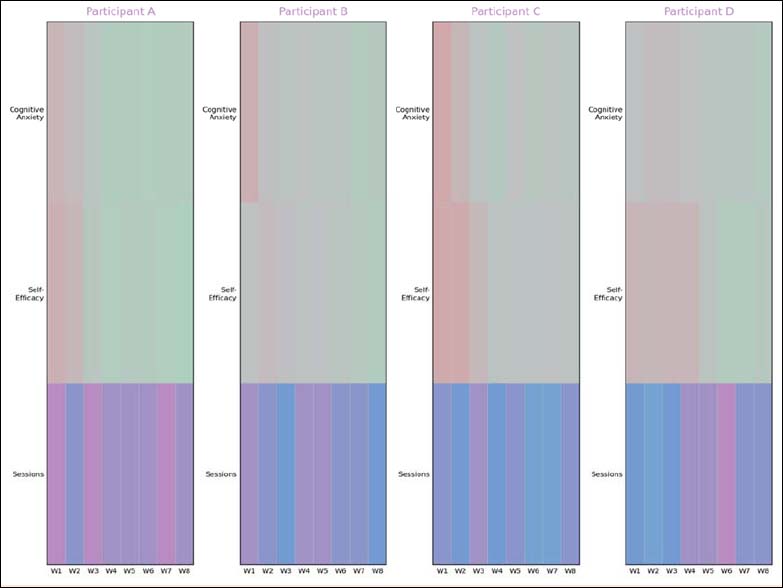
Figure 7.
Weekly psychological profile heatmaps for four intervention participants. Participants A-D were selected to illustrate rapid improvement with consistent use, gradual improvement, fluctuating response, and lower/variable engagement. Rows show cognitive anxiety, self-efficacy, and completed sessions across intervention weeks 1-8. Color intensity represents within-participant weekly values for each row, allowing visual comparison of changes over time rather than between-participant ranking.