 |
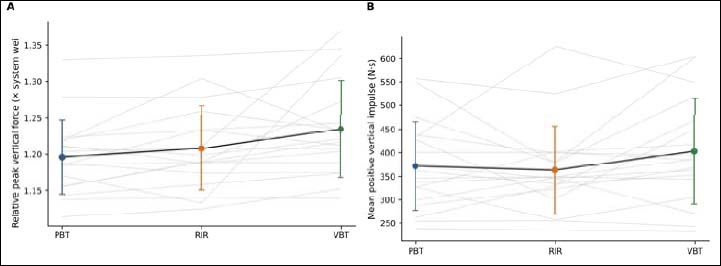
Figure 1.
Session-level mechanical output during back-squat training under PBT, RIR, and VBT. (A) Relative peak vertical force; (B) mean positive vertical impulse. Light-gray lines represent individual participant data, black lines connect condition means, and colored circles with error bars represent arithmetic means ± standard deviations. Blue, orange, and green indicate PBT, RIR, and VBT, respectively. Relative peak vertical force was normalized using the calibration force recorded separately for each set. The corresponding log-scale inferential results are reported in the text and Tables S1 and S5.