 |
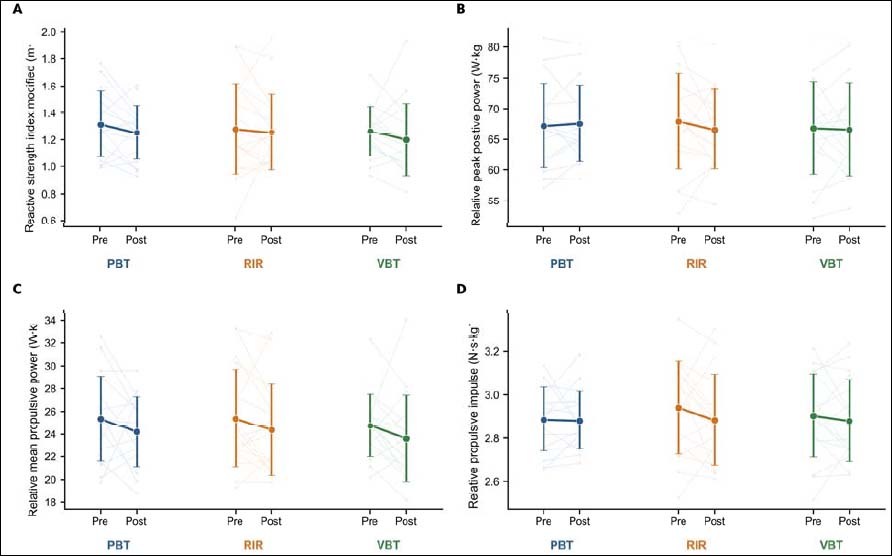
Figure S4.
Supporting squat-jump force–time outcomes under the three load-regulation protocols. (A) Modified reactive strength index (RSImod); (B) relative peak positive power; (C) relative mean propulsive power; (D) relative propulsive impulse. Light-colored lines represent individual pre- to postexercise changes, colored solid lines connect condition means, and colored circles with error bars represent mean ± standard deviation. Power and impulse were normalized to body mass.