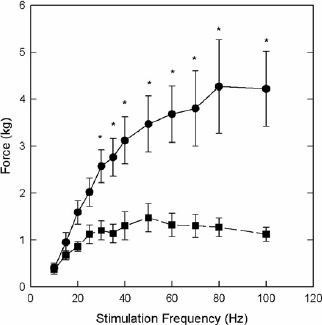
Figure 1.
Force-frequency relationship measured in absolute force of TA in SCI () and control subjects (). * Significant difference between groups (p <0.05). (Error bars represent SE).