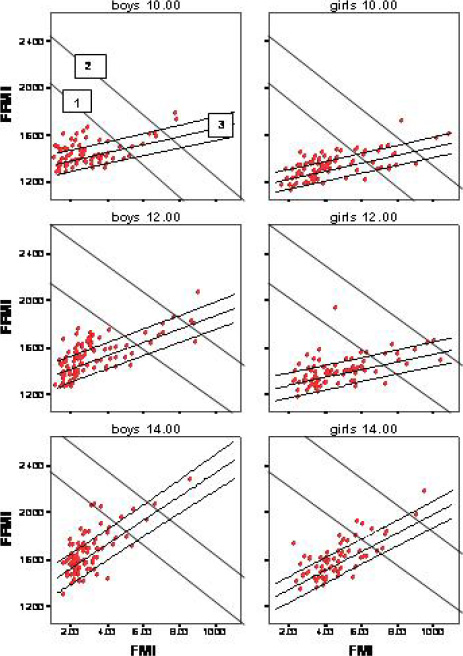
Figure 1. Allocation to body build groups. The figure shows the scatter plots with the FMI on the x-axis and the FFMI on the y-axis for the specific age en sex groups. Line 1 represents the BMI cut off point for overweight, line 2 represents the cut off point for obesity (Cole et al., 2000). Line 3 is the regression line for the FFMI predicted from the FMI, with one standard deviation above and beneath. The group ‘boys 10’ represents the group of boys in the age category 10-11, the group ‘girls 12’ represents the group of girls in the age category 12-13, etc.
