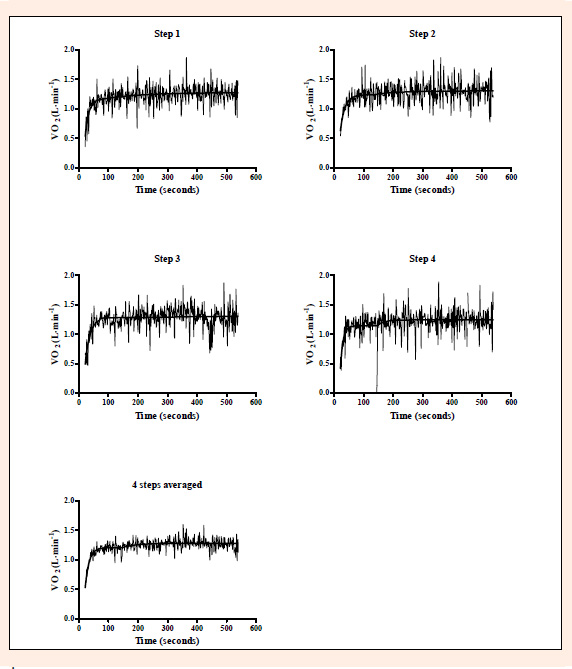
Figure 1. VO response to heavy intensity exercise for an 11 year old boy on four separate occasions, illustrating the interpolated breath-by-breath data and the best fit line using a double exponential model following phase 1 (model 3). The final graph illustrates the averaged data and the best fit line. The returned response parameters for each transition are reported in .