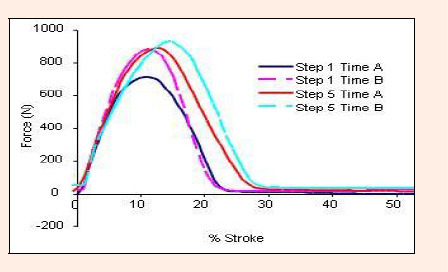
Figure 1.
An example of the changes in force curve over two of the different steps at each time point in one athlete