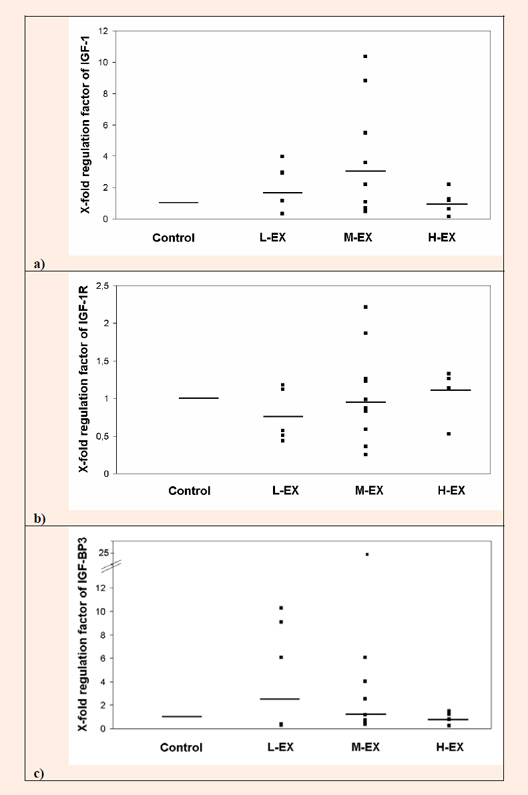
Figure 1. Gene expression of IGF-1 (a), IGF-1R (b) and IGFBP3 (c) at the mRNA level in the colon mucosa at the end of the experiment, shown as x-fold regulation factors relative to the control group. Single normalized values of control group (CO, n=9), low exercise volume group (L-EX, n=5), middle exercise volume group (M-EX, n=10) and high exercise volume group (H-EX, n=5) are shown as dots - normalized means are indicated as lines.