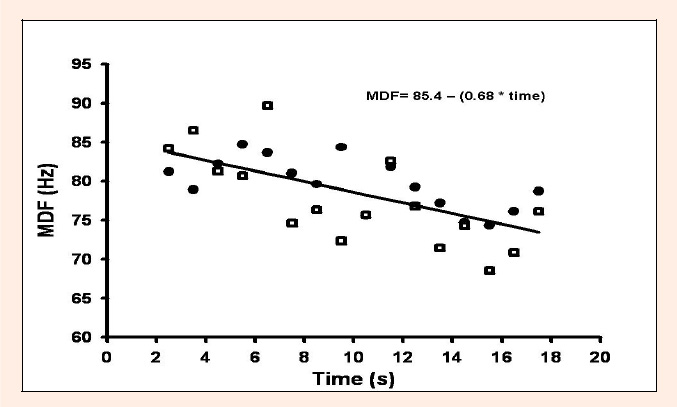
Figure 1.
Sample plot of MDF vs. time during IC50 for Exercised arm before EE. The open (â—‹) and filled (â—) symbols denote the two muscle contractions performed. Also shown is the linear regression line for both contractions, combined.