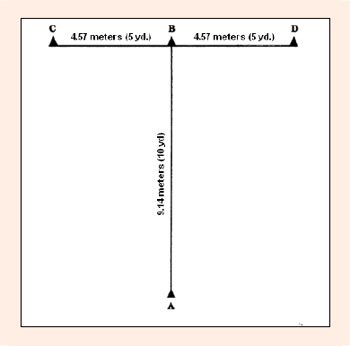
Figure 1.
Diagram of the T-test.