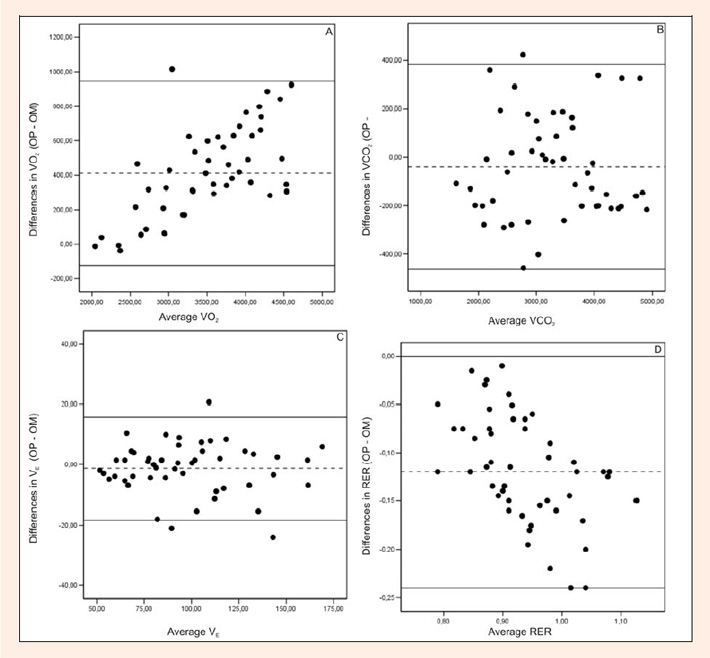
Figure 1.
Bland and Altman plots depicting absolute differences in values between OM and OP. (A) VO (ml· min); (B) VCO (ml·min); (C) V (L·min); (D) RER.