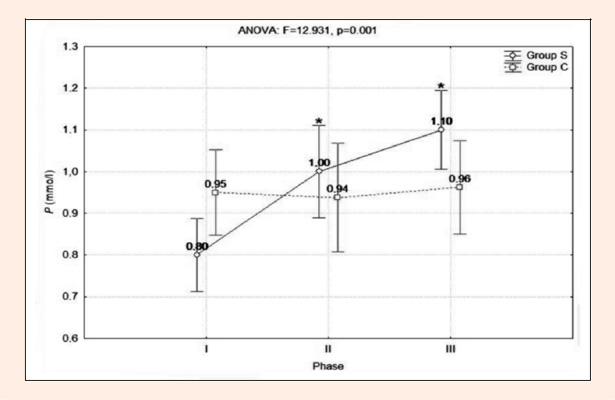
Figure 1.
; * significantly different from 1st phase (p ≤ 0.05).