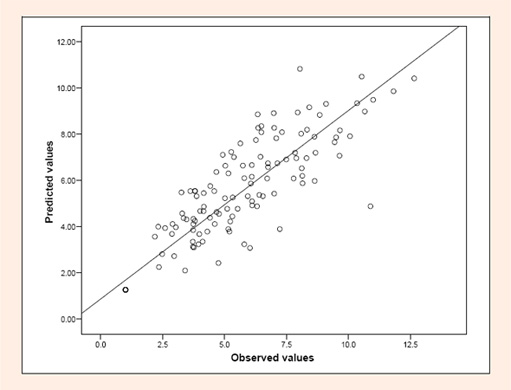
Figure 1.
Scatter plot of the estimated MET regressed versus observed MET in sample 1 (r = 0.82).