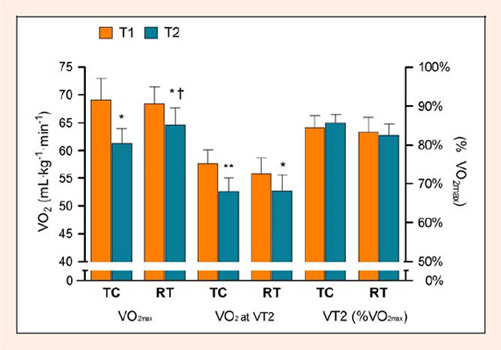
Figure 1.
Changes in VOmax, VO at VT2 and VT2 (%VOmax) following a 5-wk period of either training cessation (TC) or reduced training (RT). * p < 0.05 compared to T1; ** p < 0.01 compared to T1; † p < 0.05 compared to TC.