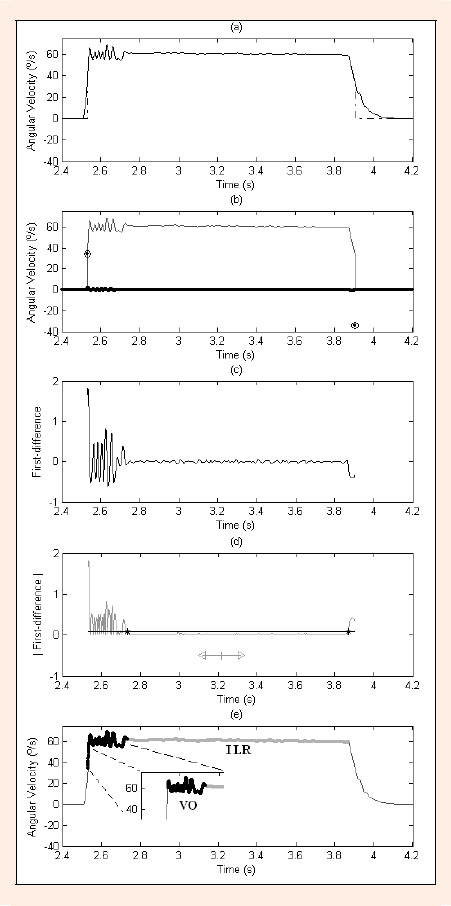
Figure 1. (a) extension knee movement (solid-line) and points less than the mean set to zero (dashed-dot line); (b) circled-dots and bold line found by the application of the first-difference; (c) zoomed image of the bold line segment between the circled-dots; (d) the absolute values of bold line segment, a straight line representing the mean value, and the asterisks delineating the isokinetic load range (ILR) segment; (e) the first and final approximation for velocity overshoot (VO).