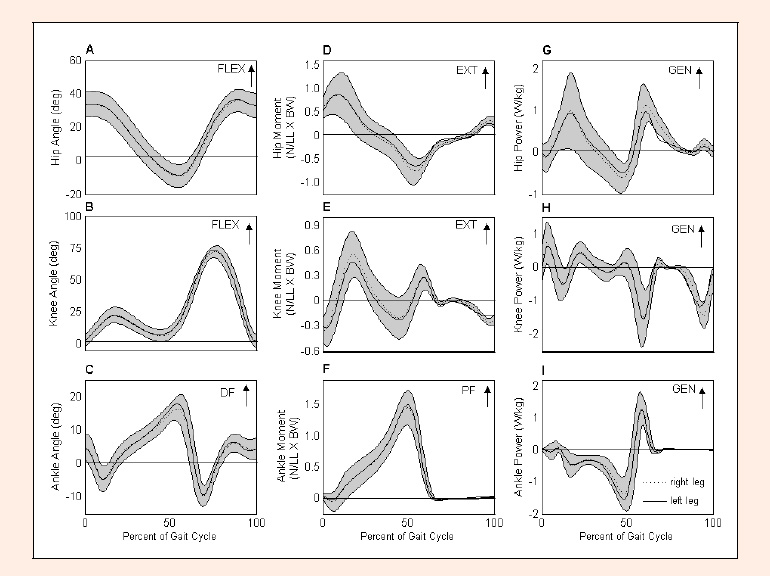
Figure 1. Means and standard deviations (shaded area) for right (dotted line) and left (solid line) legs for all recorded trials, for sagittal plane joint angles (A-C), moments (D-F), and powers (G-I). Because the standard deviations were bilaterally similar, only the standard deviations for one side (right) are shown, to increase figure clarity.