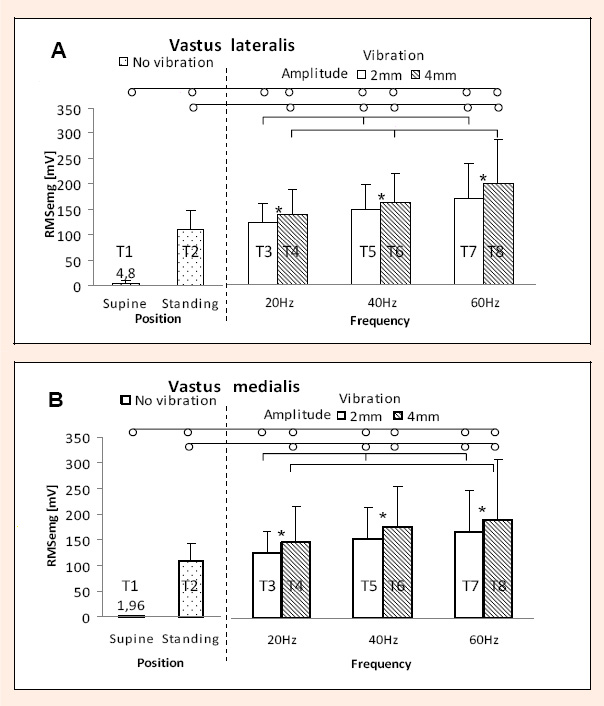
Figure 1. * indicate statistically significant differences between 2 mm and 4 mm amplitude of vibration at the same frequency (p < 0.05), horizontal bars with vertical dashes indicate statistically significant differences between frequencies at the same amplitude of vibration (p < 0.05), horizontal bars with circles indicate statistically significant differences between T1 and T2 (no vibration) and all trials with vibration (T3-T8) (p < 0.05)