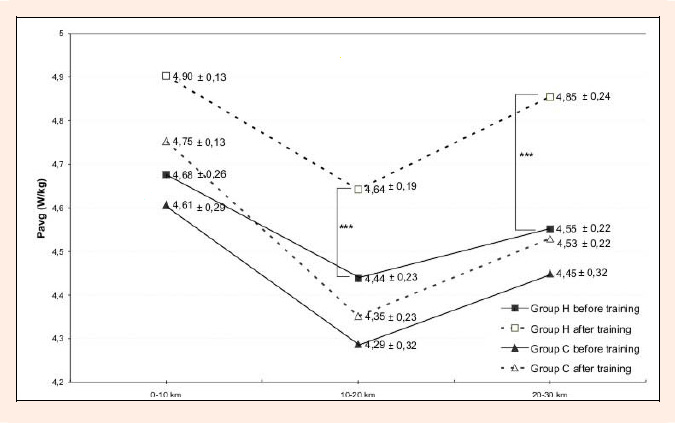
Figure 1.
Values of average relative power (Pavg) generated on each 10km stage duringthe 30 km time trial in hypoxic (H) and control (C) groups, as well as significant differences *** p < 0.05