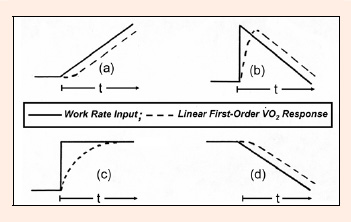
Figure 1. Schematic representation of linear first-order O uptake (VO) responses as a function of time (- - -) for (a) an incremental ramp exercise test, (b) a step-decremental ramp exercise test, (c) a step (or constant work-rate) exercise test and (d) a decremental ramp exercise test. The work rate profiles are shown as solid lines. See text for further detail.