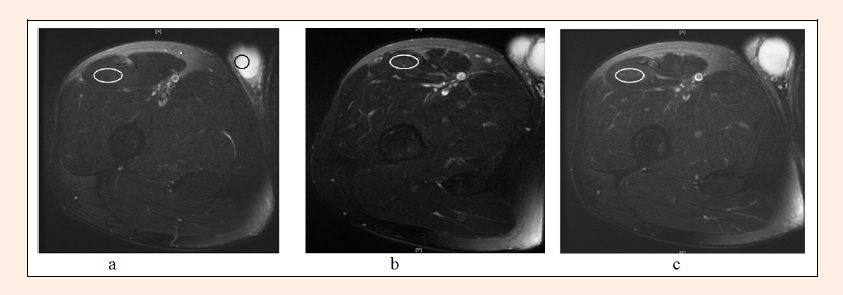
Figure 1. Sample of MRI images from one of the participants in this study. The region of interest (oval white circle) is placed in the rectus femoris muscle where T2 intensity was measured for pretest (a), after NM (b) and ER (c) trainings. The control measurement was taken from the centre of the adjacent testicle (black oval circle) as shown in Figure 1a. The ratio of the measurements forms a constant value allowing variation in display parameters.