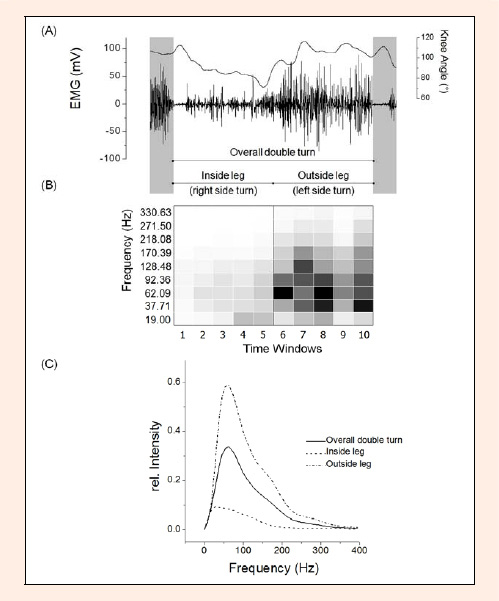
Figure 1. EMG trace and knee angle from the vastus lateralis (VL) during one double turn. (B) Myoelectric intensity of the turn is shown as a function of time and frequency, with high intensities denoted by dark shading. Ten time windows divide the overall double turn in different time frames. They are indicated by the vertical white lines. (C) Myoelectric intensity spectra for inside leg, outside leg and the overall double turn shown in (B)