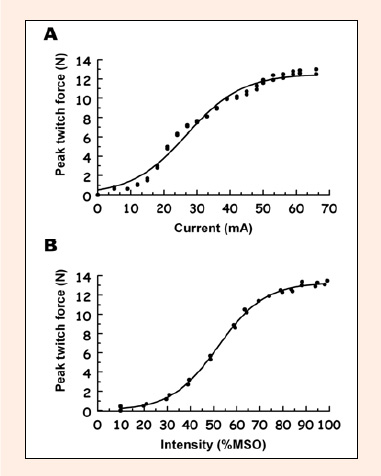
Figure 1. Examples of evoked twitch response curves to range of (A) electrical stimulation and (B) magnetic stimulation from same single subject. Two responses at each stimulus level are shown and points were fit with sigmoid curve. For estim: y=12.52/[1+exp(-(x-26.94)/8.39)], R=0.99. For magstim: y=13.30/[1+exp(-(x-51.92)/10.12)], R = 0.99.