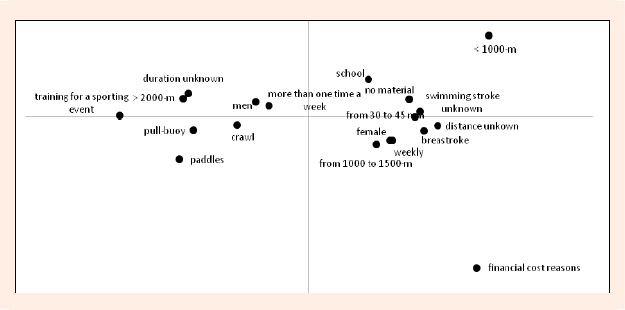
Figure 1.
Modalities whose contribution to factor 1 exceeded the average contribution in a two dimensional plot (factors 1 and 2).