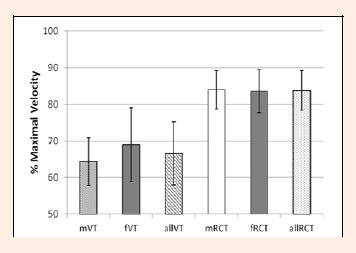
Figure 1. Mean (±SD) values for %Vmax at VT and RCT in Phase 1. Results are presented for m: male, for f: female and (because there was no significant difference between men and women) for the combined group of subjects. From this data, the mean -2SE of the VT intensity was taken as the lower 95% confidence interval for the ≤VT run in Phase 2. The mean +2SE was taken as the upper 95% confidence interval for the ≥RCT run in Phase 2.