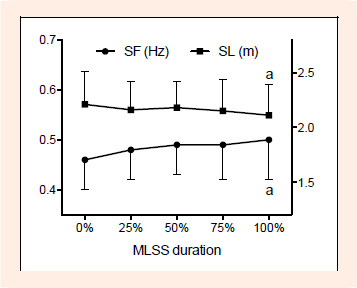
Figure 1.
Evolution through MLSS test of the mean ± SD values of the stroke frequency (SF) and stroke length (SL).
a
Significantly different from 0% (p < 0.05).