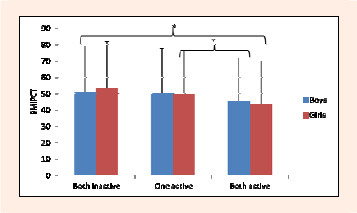
Figure 1.
Boys' and girls' BMIPCT according to their parents' activity level; displayed in mean (SD).
* p ≤ 0.05