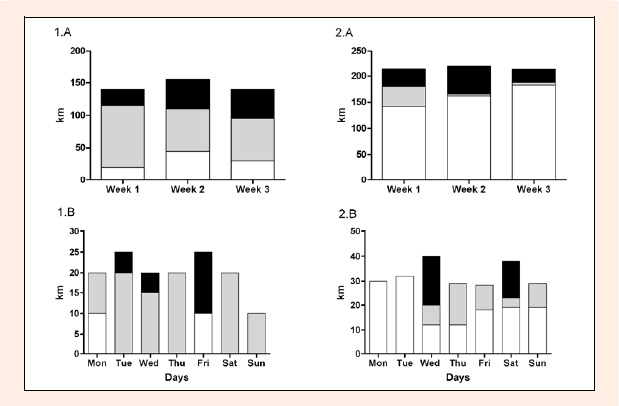
Figure 1. Upper panel; distribution of training volume and intensity during the LHTH period for participant 1 (1.A) and 2 (2.A). Lower panel; variation of training volume and intensity during the first week of LHTH for participant 1 (1.B) and 2 (2.B). White bars, intensity zone 1; grey bars, intensity zone 2; black bars, intensity zone 3.