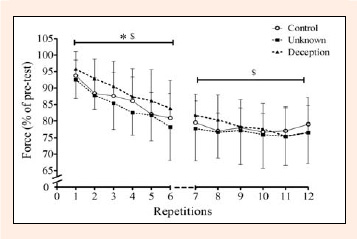
Figure 1. Mean (SD) force profile over the 12 MVCs for the 3 trials. Data is presented in percentage relative to the highest value of the pre-test. Asterix (*) indicate that was significantly higher (p ≤ 0.05) in the Deception condition relative to Unknown condition. Dollar sign ($) represents a main effect for repetitions in which force decreases across conditions (p ≤ 0.05).