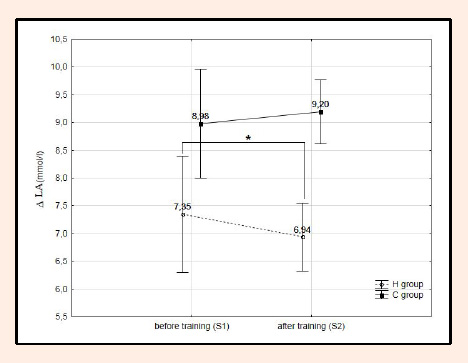
Figure 1. Increase in blood lactate concentration (∆LA) during the incremental test in the experimental group (H, n=7) and the control group (C, n=8) for the successive series of examinations. * p < 0.05 - statistically significant differences in relation to the initial measurements.