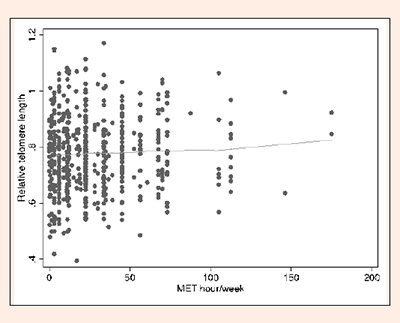
Figure 1.
Scatter plot and lowess regression line for relative leukocyte telomere length by MET hours per week.