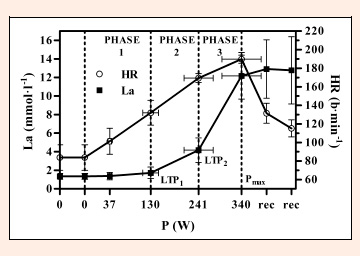
Figure 1. Performance curves for lactate and heart rate during the incremental exercise test. The three phases of lactate metabolism are separated by the first (LTP1) and second lactate turn point (LTP2). Values are means ± SD. La, blood lactate; HR, heart rate; Pmax, maximum power output from the incremental exercise test.