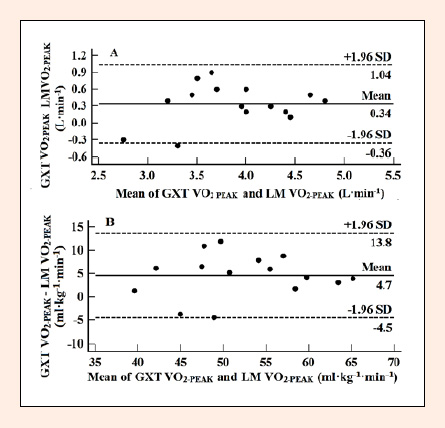
Figure 1.
Bland-Altman plot between the values of oxygen uptake obtained at the exhaustion moment (VO
2-PEAK
) of the graded exercise test (GXT) and lactate minimum test (LM) in absolute values (A) and relative to body mass (B).