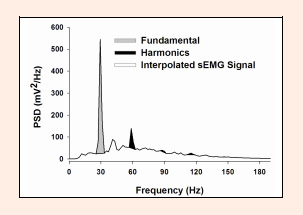
Figure 1. Example of a surface electromyography (sEMG) signal of the vastus lateralis during whole-body vibration at 30 Hz. The sEMG signals were processed in the Power Spectral Density (PSD), where the first spike (fundamental) and the following spikes (harmonics) were separated from the entire sEMG signal using spectral linear interpolation.