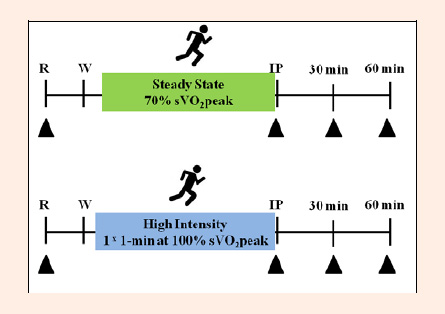
Figure 1.
Schematic representation of the study protocol. â–² Blood samples (rest, immediately, and 30 and 60 minutes after exercise). IP = immediately post-exercise; R= rest; W= warm up (n = 8).* = different from rest (p < 0.05)