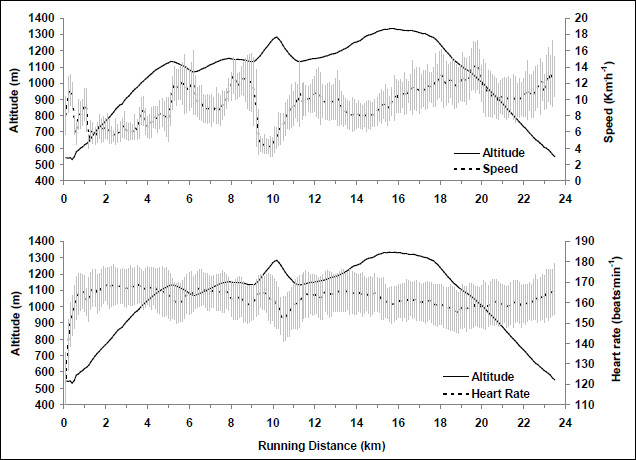
Figure 1. The altitude profile of the half-marathon race (black solid line). Mean (black dotted line) and SD (grey vertical bars) of running speed (Km·h-1) (top), and heart rate (beats/min) (bottom), superimposed on the altitude profile, for 19 of the 27 participants. Each running speed and heart rate value represents its average every 100 m of the running distance.