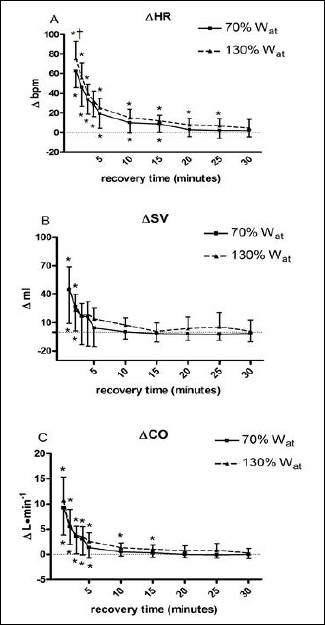
Figure 1. Changes from baseline in heart rate (∆HR, panel A), stroke volume (∆SV, panel B), and cardiac output (∆CO, panel C) during 30 recovery minutes following the 130%Wat and the 70%Wat tests. A horizontal dotted line represents the pre-exercise level. Values are mean ± SD. * = p<0.05 vs. pre-exercise; † = p<0.05 vs. corresponding time point of 70%Wat.