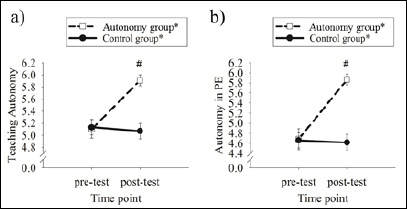
Figure 1. Illustration of perceived autonomy data as function of group and time point. a) perceived teaching autonomy and b) perceived autonomy in physical education. * significant difference within time points, p < 0.05. # s ignificant difference between the two groups, p < 0.05.