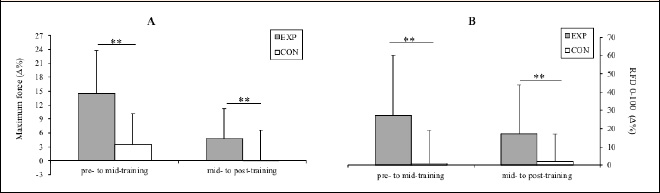
Figure 1.
Percentage change (mean ±SD) in maximum force (A) and rate of force development (B) performance in the experimental and control groups during the 8–week study period. ** p < 0.01. EXP = experimental group, CON = control.