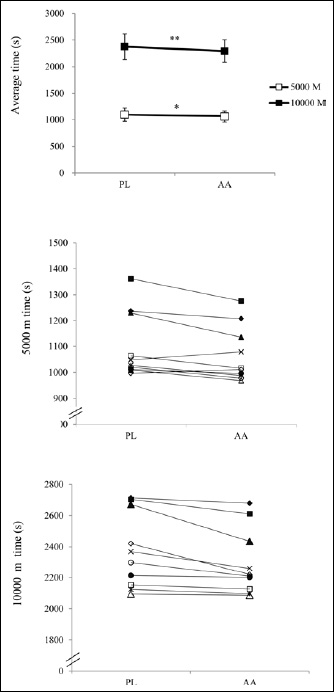
Figure 1. The results of 5000 m and 10000 m time trials in the AA and PL trials. (A, top) average time; (B, middle) individual 5000 m time; (C, bottom) individual 10000 m time). * p < 0.05; ** p < 0.01, significantly different between the AA and PL trials.