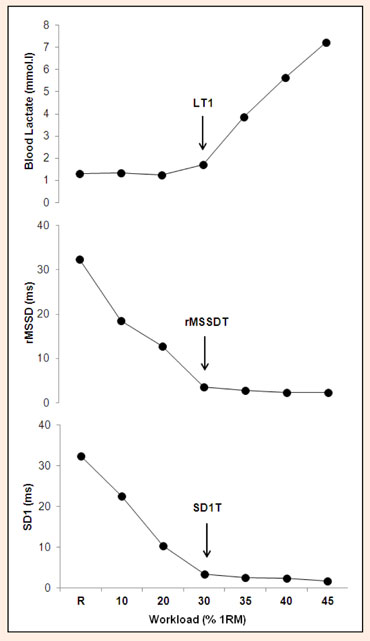
Figure 1. Graphics representation of threshold determination applied to blood lactate concentration (top); rMSSD (middle) and SD1 (bottom), signals of one representative volunteer (coronary artery disease patient). The arrow indicates the point where the threshold has been identified. LT1 = first lactate threshold; rMSSDT = rMSSD threshold (rMSSD = square root of the mean squared differences of successive RR intervals; SD1T = SD1 threshold (SD1 = standard deviation of Poincaré plot perpendicular to the line of identify).