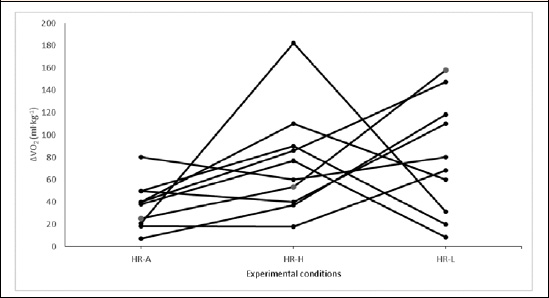
Figure 1. Individual response for ∆ V̇O2 across three experimental conditions. HR-A = actual representation of the recorded heart rate, HR-L = visual representation of the heart rate – 10 b·min-1 and HR-H = visual representation heart rate + 10 b·min-1.