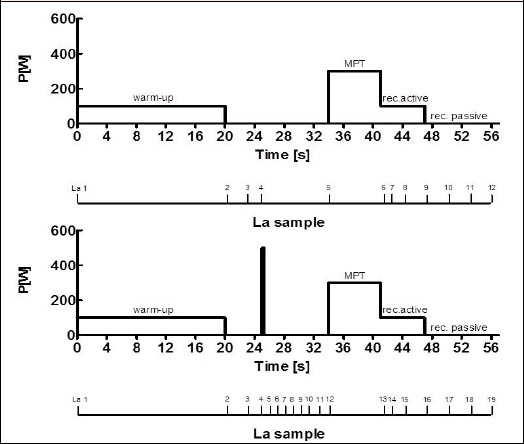
Figure 1. Different warm-up protocols for the 2000-m maximal performance test (MPT). Numbers in the upper row indicate time in min (t0-56) and numbers in the lower row (La1-19) indicate the number of blood samples to measure blood lactate concentration (La). The upper graph shows the low intensity warm-up (MPTlow) and the lower graph shows the additional high intensity pre-load (MPThigh).