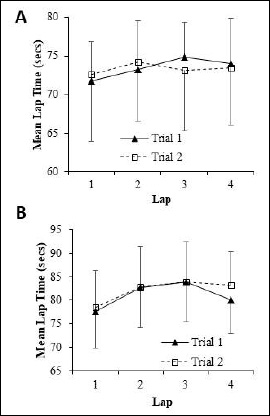
Figure 1.
Pacing profiles during trial 1 and trial 2 for self-paced (A) and paced groups (B).