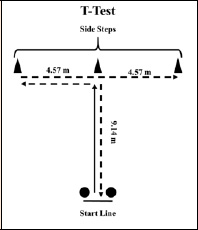
Figure 1.
Schematic presentation of the T-test. Circles represent the position of the timing gates.